In the first part of this series Fusion Charts and PostgreSQL Part 1: Database Analysis of USDA DB in our November/December 2008 issue, we did some back-seat analysis of a database we had never seen before and formulated some thoughts of things that would be useful to see in a dashboard as well as starting to develop some views to support our Dashboard. In the second part of our Fusion Charts series, we covered creating a Dashboard application in ASP.NET that demonstrated both VB.NET and C# variants using the database we loaded and prepped in Part 1.
In this part three of our series, we shall conclude by demonstrating the same application we did in ASP.NET in PHP.
We are going to create a simple dashboard that has the following features:
- A drop-down list to allow the user to pick the kind of chart to display the data in (Bar, column, funnel etc)
- A drop-down list that allows the user to pick the metric to explore -- e.g. Cholestrol, Vitamin K, Caffeine etc.
- 2 charts -- one chart showing the top 5 food groups for our metric and another showing the top 5 foods for our metric
Our final product will look like this:
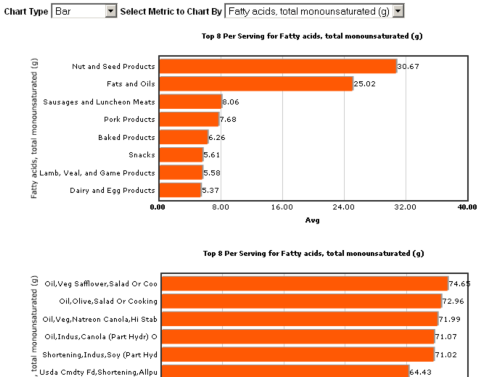
You can see the app in action - USDA Food Stats and discover some interesting things about the food you eat or were considering eating.
Tools and Structure
What we will need for this exercise will be the following:
- PostgreSQL USDA database setup from Part 1 (8.1+)
- FusionCharts Free version will do which you can download from - Fusion Charts Free
- PHP 5+
- PHP Smarty Templating Engine which you can get from www.smarty.net -
Long aside: Paragon forcing their twisted philosophies on poor unsuspecting readers. You can ignore this if you want, unless you wish to be enlightened :).
We have to add, that those who develop PHP without a templating engine should try one. For very simple applications, it might be overkill, but as your applications become more complex, it becomes extremely useful. You just can't imagine the value of a templating engine until you use one. The main benefits to us have been:- It allows you to easily cater to different devices and produce numerous output layouts without making your basic logic difficult to understand. Think for example if you have a report aht rquires you ca output in wordml, open office xmla nd html format that needs to confirm to an extremely defined design spec. It is just so much easier to do it with a template than try to generate different variants with standard PHP syntax.
- When those designers give you their vision of what a page is supposed to look like, its easier to integrate their vision into the overall architecture without screwing up your vision of how the logic should flow.
- Display concerns lend themselves to a different style of programming than what you would expect directly from a business flow tier. It keeps your sanity if these two styles aren't swashed together.
- PHP ADODB Database Abastration Layer (Note: Pear DB and others are equally good. The main benefit of a DB Abstraction layer is you don't need to remember the different function calls each db platform uses and can concentrate on just writing SQL. It also makes it a little easier to swap one db out for another.) which you can download from http://adodb.sourceforge.net/ and PHP pgsql driver enabled in php.ini
The PHP App
Begin by creating folders in your web app directories called
- templates - this will be where our .tpl file resides.
- templates_c - this needs to be writeable by your web server process and is where Smarty compiles the templates into php files
- libs - extract adodb and smarty into this directory and put the FusionCharts/FusionCharts.php such that you have 3 folders -- adodb, smarty, FusionCharts
- Create another folder called FusionCharts on root of webfolder and put the FusionCharts flash and .js files there.
<?php
define("DSN", 'postgres://usda_app:foodie@localhost:5432/usda?persist');
?>
Controller Logic - view_charts.php
<?php
require_once('config.inc.php');
require_once('libs/smarty/Smarty.class.php');
require_once('libs/adodb/adodb.inc.php');
require_once('libs/FusionCharts/FusionCharts.php');
class _view_charts extends Smarty{

    protected $db;
    protected $charttypes = array('FCF_Bar2D' => 'Bar', 'FCF_Funnel'=>'Funnel',
            'FCF_Pie3D' => 'Pie 3D', 'FCF_Column3D' => 'Column 3D',
            'FCF_Doughnut2D' => 'Doughnut');
    protected $rs_attributes;
    function __construct() {
        $this->db = NewADOConnection(DSN);
        if (!$this->db) {
            die("Connection failed");
        }
        $this->rs_attributes = $this->db->Execute("SELECT metric,  metric || ' (' || units || ')' As display
                     FROM vwfdgrpstats GROUP BY metric, units ORDER BY metric")->GetAssoc();
        $this->page_load();
    }

    function page_load(){
        $this->assign('rs_attributes', $this->rs_attributes);
        $this->assign('rs_charttypes', $this->charttypes);

        $this->assign('lit_chart_food_group', $this->create_chart("chartFoodGroup", "vwfdgrpstats"));
        $this->assign('lit_chart_food', $this->create_chart("chartFood", "vwfoodstats"));

        $this->display('view_charts.tpl');
    }

    function create_chart($achart_name, $aview_name){
        //str_xmlwill be used to store the entire XML document generated
        $str_xml = null;
        $sql = null;
        $output_tag = '';
        $topn = '8';
        $charttype = key($this->charttypes);

        //default attribute to first element in list
        $att_display = reset($this->rs_attributes);
        $att_value = key($this->rs_attributes);


        if (!empty($this->rs_attributes[$_REQUEST['dropdownlist_attribute']])){
            $att_display = $this->rs_attributes[$_REQUEST['dropdownlist_attribute']];
            $att_value = $_REQUEST['dropdownlist_attribute'];
        }

        if (!empty($_REQUEST['dropdownlist_charttype'])){
            $charttype = $_REQUEST['dropdownlist_charttype'];
        }

        //Generate the graph element
        $str_xml = "";
        switch ($charttype) {
            case "FCF_Funnel":
                $str_xml = "<chart isSliced='1' slicingDistance='4' decimalPrecision='2' subcaption='Top $topn  By "
                    . $att_display . "'>";
                $output_tag = "</chart>";
                break;
            case "FCF_Column3D":
            case "FCF_Doughnut2D":
            case "FCF_Pie3D":
            case "FCF_Bar2D":
                $str_xml = "<graph showNames='1'  decimalPrecision='2'  formatNumberScale='0' rotateNames='1' caption='Top " . $topn . " Per Serving for " .
                    $att_display .
                    "' xAxisName='" . $att_display  . "' yAxisName='Avg' >";
                $output_tag = "</graph>";
                break;
        }

        $sql = "SELECT Substr(item_name,1,30) As item_name, avgnutritionalvalue As tot, units
                    FROM   " . $aview_name . " WHERE metric = COALESCE(" .
            $this->db->qstr($att_value) . ", 'Unknown') " .
                " ORDER BY avgnutritionalvalue DESC";

        $dr = $this->db->SelectLimit($sql, $topn);


        while (!$dr->EOF) {
            $str_xml = $str_xml . "<set name='" . preg_replace('/[^A-Za-z0-9\s\s+]/',' ',$dr->fields("item_name")) . "' value='" . $dr->fields("tot") . "' />";
            $dr->MoveNext();
        }
        $dr->Close();
        $dr = null;

        $str_xml = $str_xml . $output_tag;

        //Create the chart with data from strXML
        return renderChart("FusionCharts/" . $charttype . ".swf", "", $str_xml, $achart_name, "650", "300", false, false);
    }
}
new _view_charts();
?>
	<!DOCTYPE html PUBLIC "-//W3C//DTD XHTML 1.0 Transitional//EN" "http://www.w3.org/TR/xhtml1/DTD/xhtml1-transitional.dtd">
<html xmlns="http://www.w3.org/1999/xhtml">
<head runat="server">
    <title>Charts</title>
    <SCRIPT LANGUAGE="Javascript" SRC="FusionCharts/FusionCharts.js"></SCRIPT>
    <style type="text/css">
    {literal}
    <!--
    body {
        font-family: Arial, Helvetica, sans-serif;
        font-size: 12px;
    }
    -->
    {/literal}
    </style>
    <SCRIPT LANGUAGE="Javascript" SRC="FusionCharts/FusionCharts.js"></SCRIPT>
</head>
<body>
    <form id="form1" action="{$smarty.request.url}" method="post">
    <div>
        <b>Chart Type</b>
            <select id="dropdownlist_charttype" name="dropdownlist_charttype" onchange="this.form.submit()">
                {html_options options=$rs_charttypes selected=$smarty.request.dropdownlist_charttype}
            </select>
        <b>Select Metric to Chart By</b>
            <select id="dropdownlist_attribute" name="dropdownlist_attribute" onchange="this.form.submit()">
                {html_options options=$rs_attributes selected=$smarty.request.dropdownlist_attribute}
            </select>
        {$lit_chart_food_group}
        {$lit_chart_food}
    </div>
    </form>
</body>
</html>