In the first part of this series Fusion Charts and PostgreSQL Part 1: Database Analysis of USDA DB in our November/December 2008 issue, we did some back-seat analysis of a database we had never seen before and formulated some thoughts of things that would be useful to see in a dashboard as well as starting to develop some views to support our Dashboard.
In this part, we start the fun off by building an ASP.NET app in both VB and C#. In the next part of this series, we shall perform the same feat with PHP.
We are going to create a simple dashboard that has the following features:
- A drop downlist to allow the user to pick the kind of chart to display the data in (Bar, column, funnel etc)
- A drop downlist that allows the user to pick the metric to explore -- e.g. Cholestrol, Vitamin K, Caffeine etc.
- 2 charts -- one chart showing the top 5 food groups for our metric and another showing the top 5 foods for our metric
Our final product will look like this:
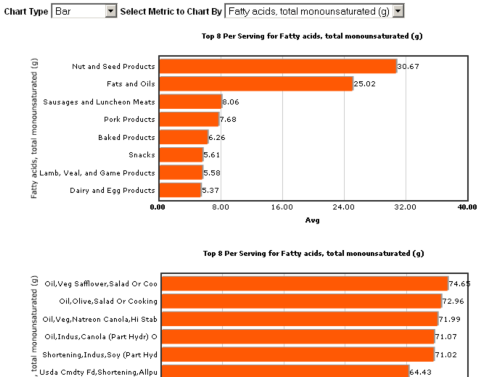
You can see the app in action - USDA Food Stats and discover some interesting things about the food you eat or were considering eating.
Our tools and Structure
What we will need for this exercise will be the following:
- PostgreSQL USDA database setup from Part 1 (8.1+)
- FusionCharts Free version will do which you can download from - Fusion Charts Free
- ASP.NET 2.0 with Framework 3+ or Mono.NET equivalent
- Npgsql.net 2.0.2 libraries for connectivity to PostgreSQL db, which you can download from http://pgfoundry.org/frs/?group_id=1000140&release_id=1273
For this exercise we shall also be using a homegrown Db wrapper to wrap the npgsql classes. This just makes it a little easier to swap one driver/database platform for another
The VB App
VB code behind - ViewChartsVB.aspx.vb
Imports InfoSoftGlobal
Partial Class ViewChartsVB
    Inherits System.Web.UI.Page
    Public DbPg As PC.Data.DbAccessor = PC.Data.DbAccessor.GetDbAccessor(System.Configuration.ConfigurationManager.ConnectionStrings("DSN").ConnectionString, _
            "PC.Data.PGSQLDbAccessor")


    Public Function CreateChart(ByVal aChartName As String, ByVal aViewName As String) As String
        'strXML will be used to store the entire XML document generated
        Dim strXML, sql As String
        Dim outputTag As String = "</chart>"
        Dim topn As String = "8"

        'Generate the graph element
        strXML = ""
        Select Case Me.DropDownListChartType.SelectedValue
            Case "FCF_Funnel"
                strXML = "<chart isSliced='1' slicingDistance='4' decimalPrecision='2' subcaption='Top " & topn & " By " & _
                    Me.DropDownListAttribute.SelectedItem.Text & "'>"
                outputTag = "</chart>"

            Case "FCF_Column3D", "FCF_Doughnut2D", "FCF_Pie3D", "FCF_Bar2D"
                strXML = "<graph showNames='1'  decimalPrecision='2'  formatNumberScale='0' rotateNames='1' caption='Top " & topn & _
                    " Per Serving for " & Me.DropDownListAttribute.SelectedItem.Text & "' xAxisName='" & _
                        Me.DropDownListAttribute.SelectedItem.Text & "' yAxisName='Avg' >"
                outputTag = "</graph>"
        End Select

        sql = "SELECT Substr(item_name,1,30) As item_name, avgnutritionalvalue As tot, units " & _
            " FROM   " & DbPg.sb(aViewName) & _
            " WHERE metric = COALESCE(" & DbPg.StringToSQLNull(Me.DropDownListAttribute.SelectedValue, PC.Data.DataTypes.DbVarChar) & ", 'Unknown') " & _
            " ORDER BY avgnutritionalvalue DESC " & _
            " LIMIT " & topn

        Using dr As System.Data.IDataReader = DbPg.GetDR(sql)
            While dr.Read()
                strXML = strXML & "<set name='" & Server.HtmlEncode(dr("item_name").ToString().Replace("&", " ")) & "' value='" & dr("tot").ToString() & "' />"
            End While
        End Using

        strXML = strXML & outputTag

        'Create the chart - Pie 3D Chart with data from strXML
        Return FusionCharts.RenderChart("FusionCharts/" & Me.DropDownListChartType.SelectedValue & ".swf", "", strXML, aChartName, "650", "300", False, False)
    End Function

    Protected Sub Page_Load(ByVal sender As Object, ByVal e As System.EventArgs) Handles Me.Load
        If Not Page.IsPostBack Then
            Me.DropDownListAttribute.DataSource = _
                DbPg.GetDataSet("SELECT metric,  metric || ' (' || units || ')' As display FROM vwfdgrpstats GROUP BY metric, units ORDER BY metric")
            Me.DropDownListAttribute.DataBind()
        End If
        If Me.DropDownListAttribute.SelectedValue > "" Then
            Me.litChartFoodGroup.Text = Me.CreateChart("chartFoodGroup", "vwfdgrpstats")
            Me.litChartFood.Text = Me.CreateChart("chartFood", "vwfoodstats")
        End If
    End Sub
End Class
ASPX display interface ViewChartsVB.aspx
<%@ Page Language="VB" AutoEventWireup="false" CodeFile="ViewChartsVB.aspx.vb" Inherits="ViewChartsVB" %>

<!DOCTYPE html PUBLIC "-//W3C//DTD XHTML 1.0 Transitional//EN" "http://www.w3.org/TR/xhtml1/DTD/xhtml1-transitional.dtd">

<html xmlns="http://www.w3.org/1999/xhtml">
<head runat="server">
    <title>Charts</title>
    <SCRIPT LANGUAGE="Javascript" SRC="FusionCharts/FusionCharts.js"></SCRIPT>
    <style type="text/css">
    <!--
    body {
        font-family: Arial, Helvetica, sans-serif;
        font-size: 12px;
    }
    .text{
        font-family: Arial, Helvetica, sans-serif;
        font-size: 12px;
    }
    -->
    </style>
</head>
<body>
    <form id="form1" runat="server">
    <div>
        <b>Chart Type</b>
        <asp:DropDownList ID="DropDownListChartType" runat="server" AutoPostBack="True">
            <asp:ListItem Text="Bar" Value="FCF_Bar2D" />
            <asp:ListItem Text="Funnel" Value="FCF_Funnel" />
            <asp:ListItem Text="Pie 3D" Value="FCF_Pie3D" />
            <asp:ListItem Text="Column 3D" Value="FCF_Column3D" />
            <asp:ListItem Text="Doughnut" Value="FCF_Doughnut2D" />
        </asp:DropDownList>
        <b>Select Metric to Chart By</b>
        <asp:DropDownList ID="DropDownListAttribute" DataTextField="display" DataValueField="metric" runat="server" AutoPostBack="True" />
        <asp:Literal ID="litChartFoodGroup" runat="server" />
        <asp:Literal ID="litChartFood" runat="server" />
    </div>
    </form>
</body>
</html>
The C# App
CS code behind - ViewChartsCS.aspx.csusing InfoSoftGlobal;
partial class ViewChartsCS : System.Web.UI.Page {
public PC.Data.DbAccessor DbPg = PC.Data.DbAccessor.GetDbAccessor(System.Configuration.ConfigurationManager.ConnectionStrings["DSN"].ConnectionString,
"PC.Data.PGSQLDbAccessor");
public string CreateChart(string aChartName, string aViewName)
{
//strXML will be used to store the entire XML document generated
string strXML = null;
string sql = null;
string outputTag = "</chart>";
string topn = "8";
//Generate the graph element
strXML = "";
switch (this.DropDownListChartType.SelectedValue) {
case "FCF_Funnel":
strXML = "<chart isSliced='1' slicingDistance='4' decimalPrecision='2' subcaption='Top " + topn + " By "
+ this.DropDownListAttribute.SelectedItem.Text + "'>";
outputTag = "</chart>";
break;
case "FCF_Column3D":
case "FCF_Doughnut2D":
case "FCF_Pie3D":
case "FCF_Bar2D":
strXML = "<graph showNames='1' decimalPrecision='2' formatNumberScale='0' rotateNames='1' caption='Top " + topn + " Per Serving for " +
this.DropDownListAttribute.SelectedItem.Text + "' xAxisName='" + this.DropDownListAttribute.SelectedItem.Text + "' yAxisName='Avg' >";
outputTag = "</graph>";
break;
}
sql = "SELECT Substr(item_name,1,30) As item_name, avgnutritionalvalue As tot, units " + " FROM " + DbPg.sb(aViewName) + " WHERE metric = COALESCE(" +
DbPg.StringToSQLNull(this.DropDownListAttribute.SelectedValue, PC.Data.DataTypes.DbVarChar) + ", 'Unknown') " +
" ORDER BY avgnutritionalvalue DESC LIMIT " + topn;
using (System.Data.IDataReader dr = DbPg.GetDR(sql)) {
while (dr.Read()) {
strXML = strXML + "<set name='" + Server.HtmlEncode(dr["item_name"].ToString().Replace("&", " ")) + "' value='" + dr["tot"].ToString() + "' />";
}
}
strXML = strXML + outputTag;
//Create the chart - Pie 3D Chart with data from strXML
return FusionCharts.RenderChart("FusionCharts/" + this.DropDownListChartType.SelectedValue + ".swf", "", strXML, aChartName, "650", "300", false, false);
}
protected void Page_Load(object sender, System.EventArgs e)
{
if (!Page.IsPostBack) {
this.DropDownListAttribute.DataSource = DbPg.GetDataSet("SELECT metric, metric || ' (' || units || ')' As display " +
" FROM vwfdgrpstats GROUP BY metric, units ORDER BY metric");
this.DropDownListAttribute.DataBind();
}
if (! (this.DropDownListAttribute.SelectedValue == "")) {
this.litChartFoodGroup.Text = this.CreateChart("chartFoodGroup", "vwfdgrpstats");
this.litChartFood.Text = this.CreateChart("chartFood", "vwfoodstats");
}
}
}
<%@ Page Language="C#" AutoEventWireup="true" CodeFile="ViewChartsCS.aspx.cs" Inherits="ViewChartsCS" %>

<!DOCTYPE html PUBLIC "-//W3C//DTD XHTML 1.0 Transitional//EN" "http://www.w3.org/TR/xhtml1/DTD/xhtml1-transitional.dtd">

<html xmlns="http://www.w3.org/1999/xhtml">
<head runat="server">
    <title>Charts</title>
    <SCRIPT LANGUAGE="Javascript" SRC="FusionCharts/FusionCharts.js"></SCRIPT>
    <style type="text/css">
    <!--
    body {
        font-family: Arial, Helvetica, sans-serif;
        font-size: 12px;
    }
    .text{
        font-family: Arial, Helvetica, sans-serif;
        font-size: 12px;
    }
    -->
    </style>
</head>
<body>
    <form id="form1" runat="server">
    <div>
        <b>Chart Type</b>
        <asp:DropDownList ID="DropDownListChartType" runat="server" AutoPostBack="True">
            <asp:ListItem Text="Bar" Value="FCF_Bar2D" />
            <asp:ListItem Text="Funnel" Value="FCF_Funnel" />
            <asp:ListItem Text="Pie 3D" Value="FCF_Pie3D" />
            <asp:ListItem Text="Column 3D" Value="FCF_Column3D" />
            <asp:ListItem Text="Doughnut" Value="FCF_Doughnut2D" />
        </asp:DropDownList>
        <b>Select Metric to Chart By</b>
        <asp:DropDownList ID="DropDownListAttribute" DataTextField="display" DataValueField="metric" runat="server" AutoPostBack="True" />
        <asp:Literal ID="litChartFoodGroup" runat="server" />
        <asp:Literal ID="litChartFood" runat="server" />
    </div>
    </form>
</body>
</html>