In our Product Showcase section of this issue, we introduced Fusion Charts which is a flash-based charting product that makes beautiful flash charts. It comes in both a free and a non-free more bells and whistles version.
In this 3-part series article we shall demonstrate using this with a PostgreSQL database, building a simple dashboard with ASP.NET and PHP. We shall demonstrate both C# and VB.NET both using the PostgreSQL NPGSQL driver.
For this first part we shall simply load the database, do a quick analysis of what we've got to report on and create some views to help us with our PHP and ASP.NET apps that will follow in parts 2 and 3.
We will be testing this on 8.3, but since the database is an old one, it should work just fine on older versions of PostgreSQL. We'll try to refrain from using new features of PostgreSQL.
Loading the USDA Database
For the database, we shall be using the usda (USDA The US Department of Agriculture's public domain food and nutrient database) which you can download from http://pgfoundry.org/projects/dbsamples/.
Now for the load
- Extract the tar.gz file.
- Launch your shell - if you are on windows you'll want to use the Start->Program Files->PostgreSQL someversion->Command Prompt
psql -h localhost -p 5432 -U postgres -c "CREATE DATABASE usda WITH ENCODING='UTF8';"
psql -h localhost -p 5432 -f /path/to/usda.sql -U postgres -d usda
psql -h localhost -p 5432 -U postgres -c "CREATE ROLE usda_app LOGIN PASSWORD 'foodie' NOSUPERUSER INHERIT NOCREATEDB NOCREATEROLE;
Now this database turns out to be somewhat rich for a demo db. It helps to look at the relationships in a relational designer to get a breath of what metrics we can glean from here. So lets itemize what we have here.
We covered installing Open Office's PostgreSQL SDBC driver in Using OpenOffice Base 2.3.1 with PostgreSQL
Installing the driver is the same in OpenOffice 3.0
Analyzing what we have
Below is a snapshot of what our loaded database relationships look like in OpenOffice 3.0
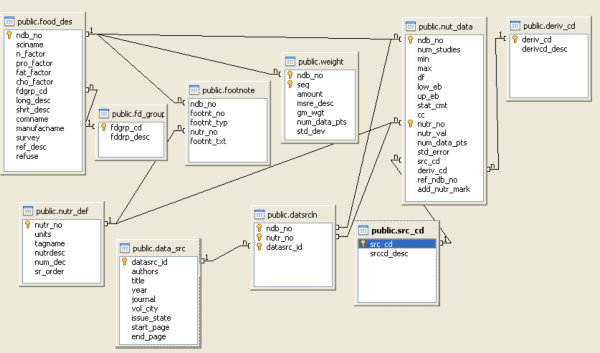
Now lets see what we have here and what interesting questions we can answer and graph from this data. Since we have no instructions to go by aside from the relationships and the data we see, we'll make some educated guesses.
Tables- data_src -- appears to be a list of some food research articles.
- datsrcln -- correlates articles to nutritional data (nut_data) as we can see from relationships.
- deriv_cd -- some sort of lookup table to denoting short names - that define if nutritional is derived, calculated or analytical.
- fd_group -- lookup table defining food groups
- food_desc -- catalog of various foods
- foot_note -- general notes about a food stats. Only has one record so can't be that interesting.
- nut_data -- various stats collected about each food.
- nutr_def -- lookup table defining the various stat types about food. Things like protein, lactose, etc. concentration
- src_cd -- superclass of source of information - is it analytical, derived etc.
- weigth -- different unit types and gram weight of 1 unit of each for each food.
What do we want to know
Looking at the data, some interesting questions come to mind. We may expand on this as we get into the app. Anyone with other thoughts are free to suggest.
- What are the top 10 foods that provide the most protein, caffein, sugar, etc, pick your favorite metric?
- Which food groups have the highest average concentration of protein, caffeine, sugar, pick your favorite metric?
Creating Views and granting rights
For this section note we are living out with metrics like 18:0, 14:0. I have no clue what those things are.
Create a view to provide basic food stats by metric
CREATE OR REPLACE VIEW vwfdgrpstats AS
 SELECT g.fddrp_desc AS item_name, g.fddrp_desc AS food_group,
 nutr_def.nutrdesc AS metric, round(avg(nut_data.nutr_val)::numeric, 3) AS avgnutritionalvalue,
 nutr_def.units
   FROM food_des f
   JOIN fd_group g ON f.fdgrp_cd = g.fdgrp_cd
   JOIN nut_data ON nut_data.ndb_no = f.ndb_no
   JOIN nutr_def ON nutr_def.nutr_no = nut_data.nutr_no
   WHERE nutr_def.nutrdesc NOT LIKE '%:%'
  GROUP BY g.fddrp_desc, nutr_def.nutrdesc, nutr_def.units;

GRANT SELECT ON TABLE vwfdgrpstats TO usda_app;
Create view to get average stats about food groups by unit and metric
CREATE OR REPLACE VIEW vwfoodstats AS
 SELECT initcap(f.shrt_desc) AS item_name, f.shrt_desc AS food_name,
 g.fddrp_desc AS food_group, nutr_def.nutrdesc AS metric,
 round(avg(nut_data.nutr_val::numeric), 3) AS avgnutritionalvalue,
 nutr_def.units
   FROM food_des f
   JOIN nut_data ON nut_data.ndb_no = f.ndb_no
   JOIN nutr_def ON nutr_def.nutr_no = nut_data.nutr_no
   JOIN fd_group g ON f.fdgrp_cd = g.fdgrp_cd
     WHERE nutr_def.nutrdesc NOT LIKE '%:%'
  GROUP BY f.shrt_desc, g.fddrp_desc, nutr_def.nutrdesc, nutr_def.units;