What happens when you take a bunch of auto-generated tests and test results which you burn into rasters with SQL? You get a code fingerprint of sorts. Well that was the dream I wanted to explore. Now that PostGIS 2.0 has introduced a new spatial type called raster and lots of functionality including some very cool Map Algebra functionality to go with it, this is now possible without too much fuss. My first attempt at it didn't produce quite what I expected. I have to admit it is absolutely gorgeous and will be hopefully useful once I figure out how to read it, tweak the rendering process to achieve more of a breakout of results, or patent it as a fabric style.
Now for the story of how a computer nerd is born and how rasters can be useful to nerds.
When I was a kid of yeh 9 or 10 years of age, I used to write code in BASIC , save it to a data tape recorder/player, and then listen to the signals on an audio tape recorder/player. I found it amusing that both devices utilized the same media but expressed the signals a bit differently. I put myself to sleep with those sounds much like normal kids listen to human generated music: the screeching, the abrupt changes in pitch that sounded to me like cars gliding along and then crashing into each other ; I wondered what piece of my code was playing at this very moment?. Looking down an electronic microscope when I was working in a molecular biology lab in high school brought similar joy. I thought wow that looks like the universe being born. Thus started my long time love and fascination with data and signal processing.
Raster's (imagery) are matrices (often sparse) and n-dimensional in nature where you can think of each band as a dimension. They are fundamentally a data storage /presentation mechanism often for environmentally generated data with visualization being one mechanism of expression. I had a dream recently about how would I digest all the PostGIS battery of tests into something I can quickly scan, compare, overlay much like a doctor's X-ray, and diagnose problems. Ah I see a problem and it's right there!. That is what Map Algebra is for and the combination with SQL I find pretty hot. Sadly its only a hotness that computer nerds can probably appreciate so nothing I can discuss in family gatherings except possibly with my brother.
That brings up the question of how can you represent right there? What does right there mean when it is not about physical space? If I asked you, given these failures, where in your code is right there? if you are intimately familiar with your code, you probably have a spot in your brain that has mapped out an almost physical map of all the parts of your code, such that right there is just as physical of a place to be as the ground you walk on though perhaps with more dimensions than the ground you walk on.
While we think of space as being physical -- that is merely a manifestation of it. Its positioning is purely based on how you define its continuity. So I thought to myself, if I could look at the tests in the context of some continuum of space, how would I define it so that I could quickly grasp the meaning of 80,000 tests in one glance? So in short converting my mental map to something visual that had little blip lights telling me where there are problems.
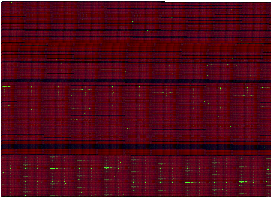
Imagine a grid where each cell defines a different test. The rows and columns are somewhat arbitrarily broken -- mostly so I can fit it on my monitor. I could just as well have a 1-row many many column strand like DNA. Now what do I put in those cells? Well my cells have bands where each band stores a different metric of my test as a number.
- I've got a band defining the complexity of inputs to the test (which I visualize as a reddish color).
- A band to measure how long the test took -- if it fails the value is null (undefined) and this I visualize as greenish.
- Then the last band I define as the size of my output
Now my tests are generated by running through functions in sequence often in family order of functions with family order of inputs, so in a sense a function test next door is more closely related than a test further away. So there is a continuum of sorts even if it is in just my head.
We've just defined a raster and rasters of this type created from the same battery of tests will map out the same space assuming we define our space continuum the same. This means you can overlay two batteries of tests and compare them pixel by pixel across each band and they overlay perfectly. More importantly you can just look at the generated raster (after you apply some transformations to make it viewable), and with some coaching have those millions of sensors in your eye register -- Ah the problem is right there! and that right there would now have an uncontestable visual manifestation.
Later on I'll demonstrate some concrete code that explores what we PostGIS devs like to call Seamless Vector Raster operations. Those who think "relational databases" should not be performing these sacrilegious exercises may not want to view the next episode or may choose to keep their eyes closed lest they turn to stone.