I'm one of those old-fashioned folks that debugs with print lines and raise notices. They're nice. They always work, you can put clock time stops in there and don't require any fancy configuration. At a certain point you do have to pull out a real debugger to see what is going on. This often happens when your one-liners are no longer good enough and now you have to write 20 liners of plpgsql code.
Such is the case with geocoding and the PostGIS tiger geocoder specifically. Lots of interest has revived on that with people submitting bug reports and we've got paying clients in need of a fairly easy and speedy drop-in geocoder that can be molded to handle such things as road way locations, badly mis-spelled real estate data, or just simply to get rid of their dependency on Google, Yahoo, MapQuest, ESRI and other online or pricey geocoding tools. So I thought I'd take this opportunity to supplement our old-fashioned debugging with plpgsqldebugger goodness. In this article, we'll show you how to configure the plpgsql debugger integrated in PgAdmin and run with it.
Installing and configuring the PgAdmin PL/PgSQL debugger
The pgAdmin plpgsql debugger has existed since PgAdmin 1.8 and PostgreSQL 8.3, so you need at least that version of PgAdmin and PostgreSQL to use it. You also need to run it under a super user account. So that unfortunately rules it out as an option for many use-cases. After all those conditions are met it takes a couple more steps to run with it. The libraries needed for it come prepackaged with EnterpriseDb packaged Windows/Linux/Mac OSX one click PostgreSQL installs and binaries. Not sure if it comes packaged with others or not. I tend to use it just in development mode so don't have installed on any of our production servers.
- Edit your server's postgresql.conf file in your data cluster and add the debugging shared library to your shared_preload_libraries. Make sure ot get rid of # remark if its present.:
shared_preload_libraries = '$libdir/plugins/plugin_debugger.dll'The profile one is optional. Note: the above is for windows server. If you are on Linux it would be:
shared_preload_libraries = '$libdir/plugins/plugin_debugger.so' - Install the file pldbgapi.sql in the database you want to debug plpgsql functions in. This is usually in the /share/contrib folder of your PostgreSQL install. You install it the same regardless of if you are on PostgreSQL 8.3-9.1.
- Restart your PostgreSQL server process.
Now we are ready to take the debugger for a test drive.
Using the plpgsql debugger
If you have installed the debugger correctly, when you open up PgAdmin III and navigate to the database you installed the debugger module and right-mouse click a plpgsql function, you should see a new Debug option with Debug and Set breakpoint sub-options as shown
 .
.- Choose the Debug option. This will allow you to type in arguments to the function. So for example for debugging my function of interest, my screen looks like this
after I click Debug and fill in my argument
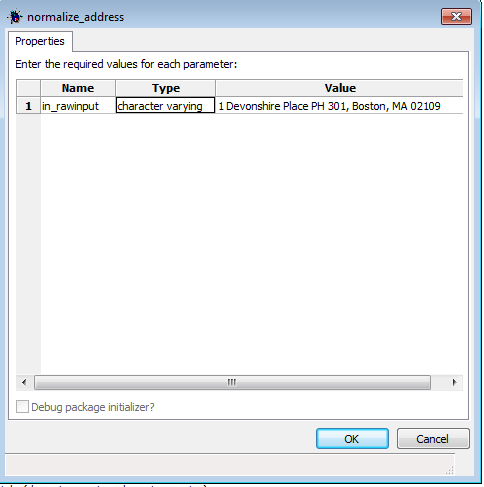 .
. - Once you've filled in the parameters, click the OK button, and you should get a screen that looks something like:
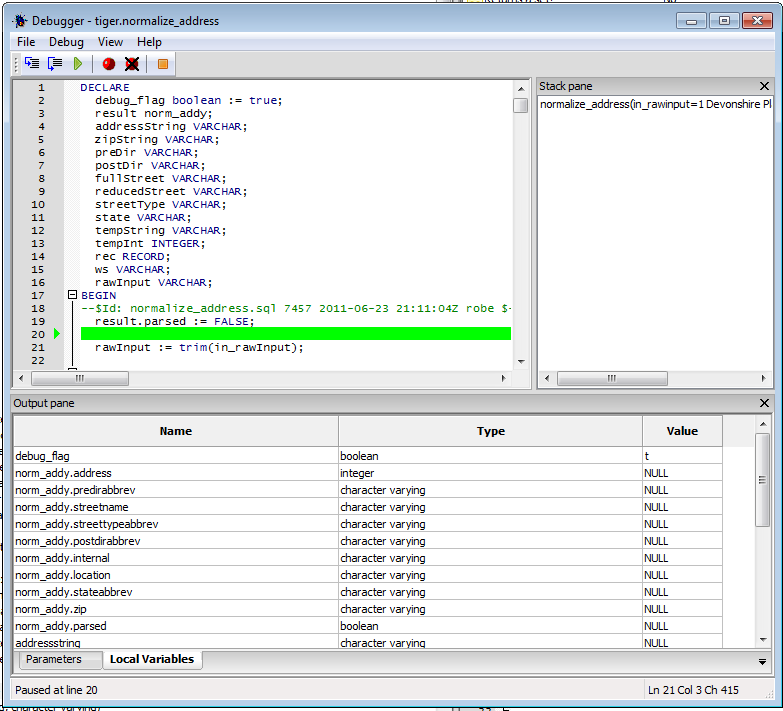
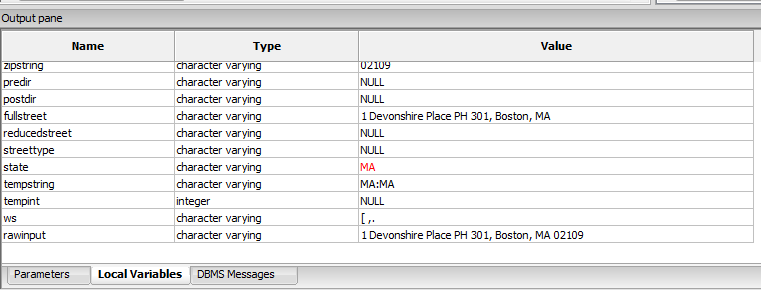
It's your basic debug with one panel showing the function code, allowing you to step thru and toggle breakpoints, a local variables panel showing you variables in function and highlighting when they change, a stack pane to monitor the calls, and a not too interesting Parameters pane to show you waht you type in for the function. It's a bit more interesting when you step thru other functions being called.
- Now we click the step into (F11) to see it in action.
A DBMS Messages output pane becomes visible too if you happen to have notices in your function.
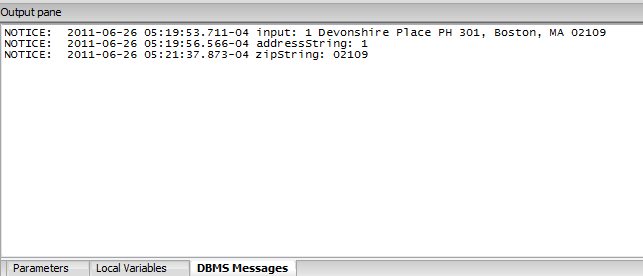
The Stack Pane shows what functions you are currently running, useful if your function calls other functions. If you do a step thru, you will also end up stepping into the other functions.
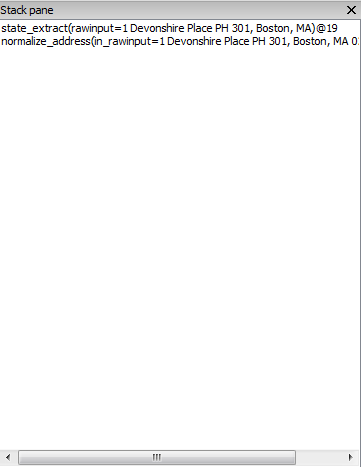
The Local Variables Pane changes as you step thru and the most recent change is marked in red:
Once the function is done running, the Output Pane shows the result.
